I’m going to be honest with you. I’m bad at writing Pandas data transformation code. Throughout the years I mostly focussed on the Spark APIs in Scala and PySpark, SQL, dbt, and some others, but I find the Pandas APIs usually just confusing and hard to read. I don’t like the black box magic and lock-in of low-code solutions either. Did you know that Microsoft Fabric has the perfect middle ground for this? It’s called Data Wrangler. Let’s dive in!
Actually, Data Wrangler is not a new thing. It was built as an extension for Visual Studio Code. It assists data engineers to wrangle their data with an intuitive interface that helps you write Pandas code. Microsoft nicely integrated this into the Fabric experience to make it even easier to use.
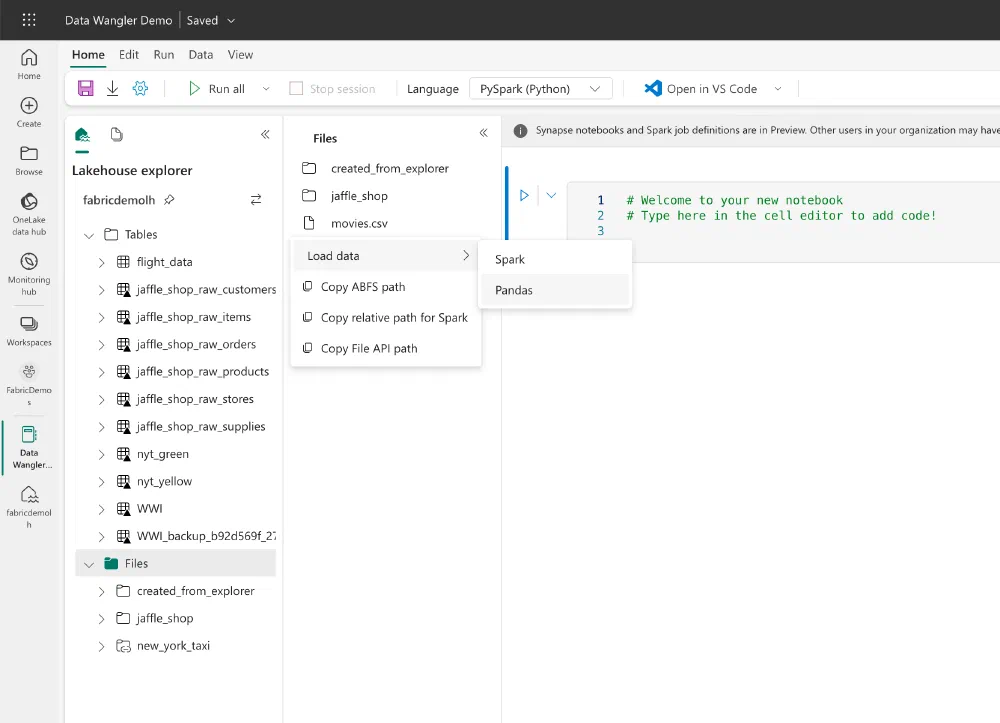
To get started with Data Wangler, create a new notebook in your Fabric Workspace. A notebook needs a Fabric Lakehouse and in our tutorial, we’re going to need some data to wrangle. I uploaded this CSV file with the most popular movies & series on IMDB to my Lakehouse and linked the Lakehouse to my notebook. To get started with wrangling data, we need to load our CSV into a Pandas DataFrame. The syntax to read a CSV file with Pandas is pretty straightforward, but you can save yourself the hassle by right-clicking on the CSV file.
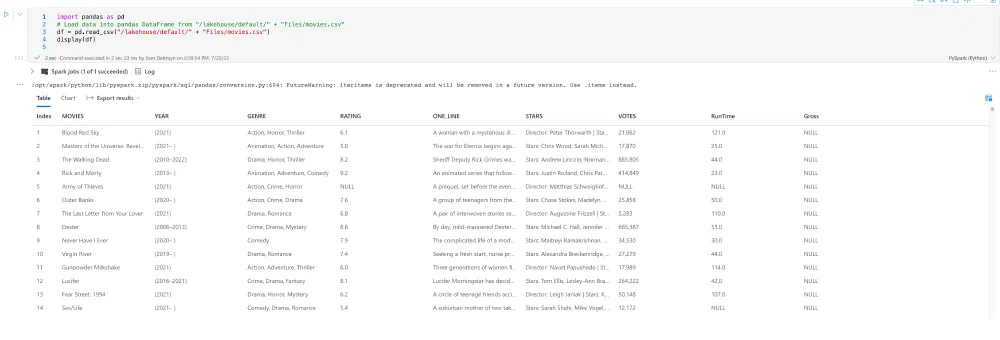
This puts the code to load the CSV file in the first cell so all you have to do is click the :play_button: button to execute the code. You can see the result right below.
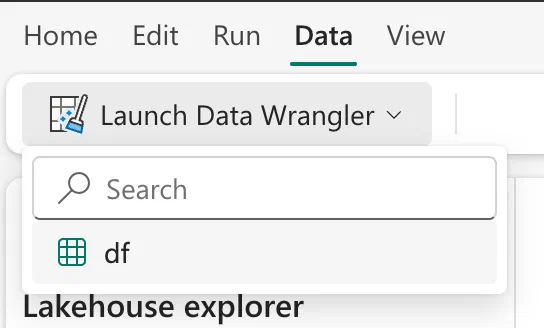
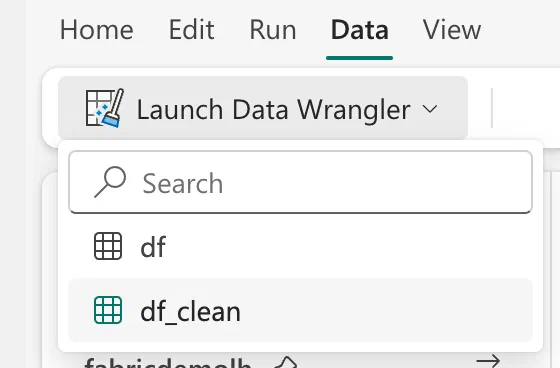
This has now loaded the DataFrame into the current session and we can now start wrangling! To get to the Data Wangler, click the Data button and select the DataFrame (df in my example) you want to wrangle.
Instantly, you get thrown into a clarifying overview of your data. You get statistical facts, nice histograms, and lots more without having to write a single line of code. Amazing!
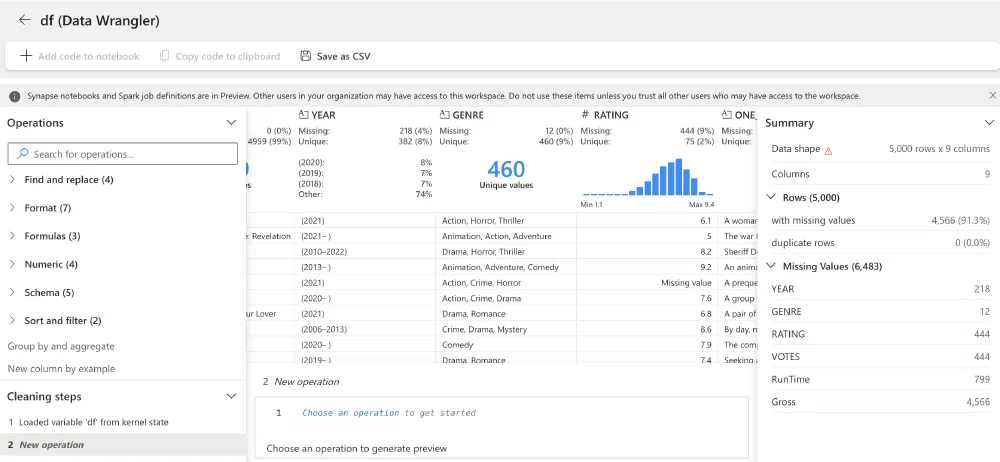
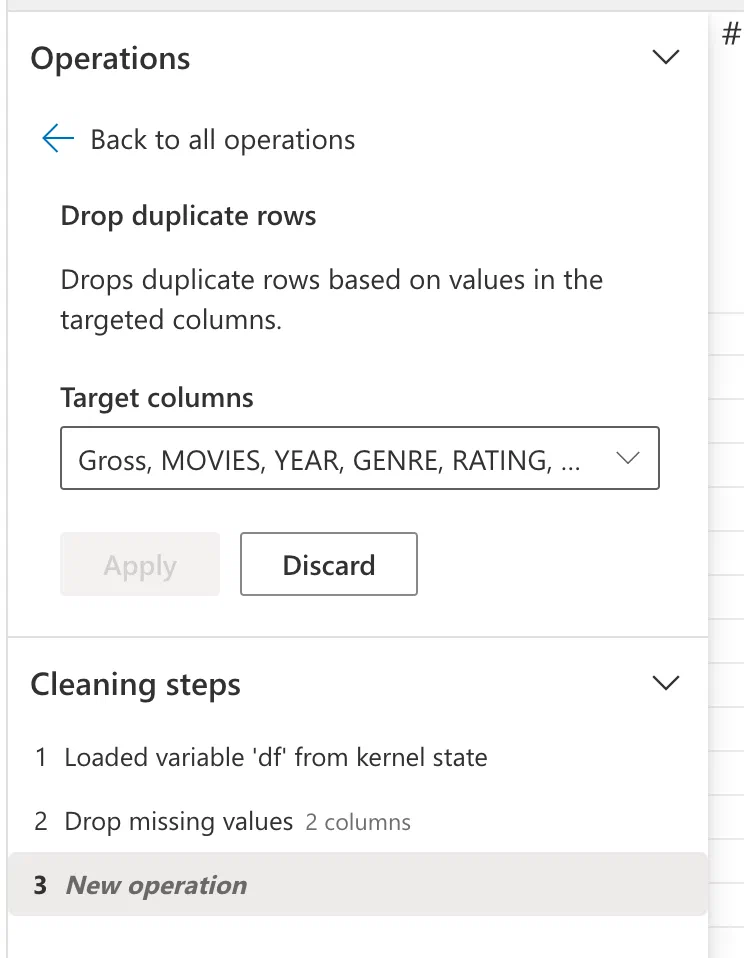
But my data is not clean. So how do we start? At the left bottom corner, you see a list of operations currently applied to your DataFrame. That list is empty now, but we’re going to add some basic data cleansing operations to it. Let’s start with a basic one: dropping all rows with missing values and dropping all duplicate rows. All we have to do is browse through the list of available operations in the menu on the left and pick the operation we want to apply. For every operation, there are some parameters you can set. In our case, we had to identify the columns which should never be empty or the columns used to detect duplicates. Easy peasy!
The Fabric Data Wangler instantly calculates and shows us the results. Where is the code now, you ask? Well, it’s right there at the bottom of your screen while you’re configuring an operation. If you now want to put that code into your notebook, the button Add code to notebook allows you to do so.
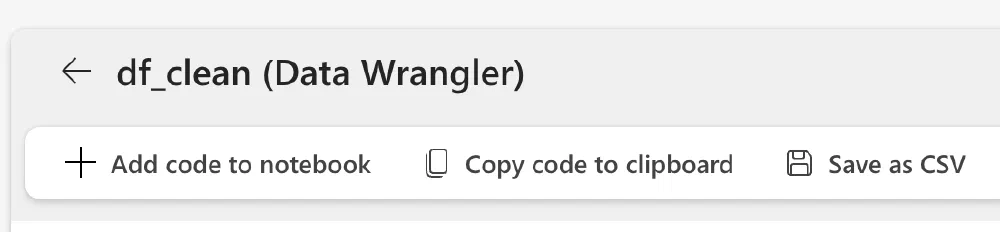
This takes you back to the notebook, and well … you guessed it, the code is there!
For me it generated this cell:
 1def clean_data(df):
 2    # Drop rows with missing data in columns: 'MOVIES', 'YEAR'
 3    df = df.dropna(subset=['MOVIES', 'YEAR'])
 4    # Drop duplicate rows in columns: 'MOVIES', 'YEAR'
 5    df = df.drop_duplicates(subset=['MOVIES', 'YEAR'])
 6    # Change column type to string for column: 'YEAR'
 7    df = df.astype({'YEAR': 'string'})
 8    return df
 9
10df_clean = clean_data(df.copy())
11df_clean.head()
What stands out to me is that even generated comments to explain what the code does. This is a great way to learn Pandas code!
I couldn’t get enough of this productive and fun way to wrangle my data and learn Pandas code. Next, I wanted to fix the YEAR column. For this, I decided to write the code myself, so I just added a new cell and a few lines to remove the characters I didn’t want to have in that column:
1df_clean["YEAR"] = df_clean["YEAR"].str.replace("(", "")
2df_clean["YEAR"] = df_clean["YEAR"].str.replace(")", "")
3df_clean["YEAR"] = df_clean["YEAR"].str.replace(" ", "")
4display(df_clean)
Wrangling more data? Just execute all cells and you can see the new df_clean pop-up in the same menu as before to open the Data Wrangler.
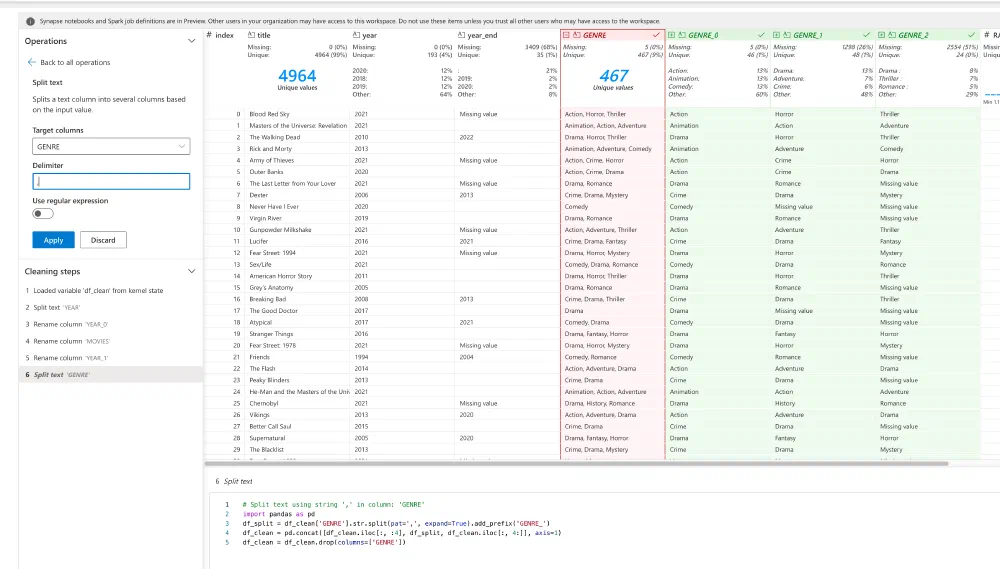
My YEAR column is far from finished. Sometimes it contains a start and an end, and sometimes only a single year. Let’s split that. The Data Wrangler in Fabric has an operation to do exactly that. While we’re at it, let’s do the same with the GENRE column as well.
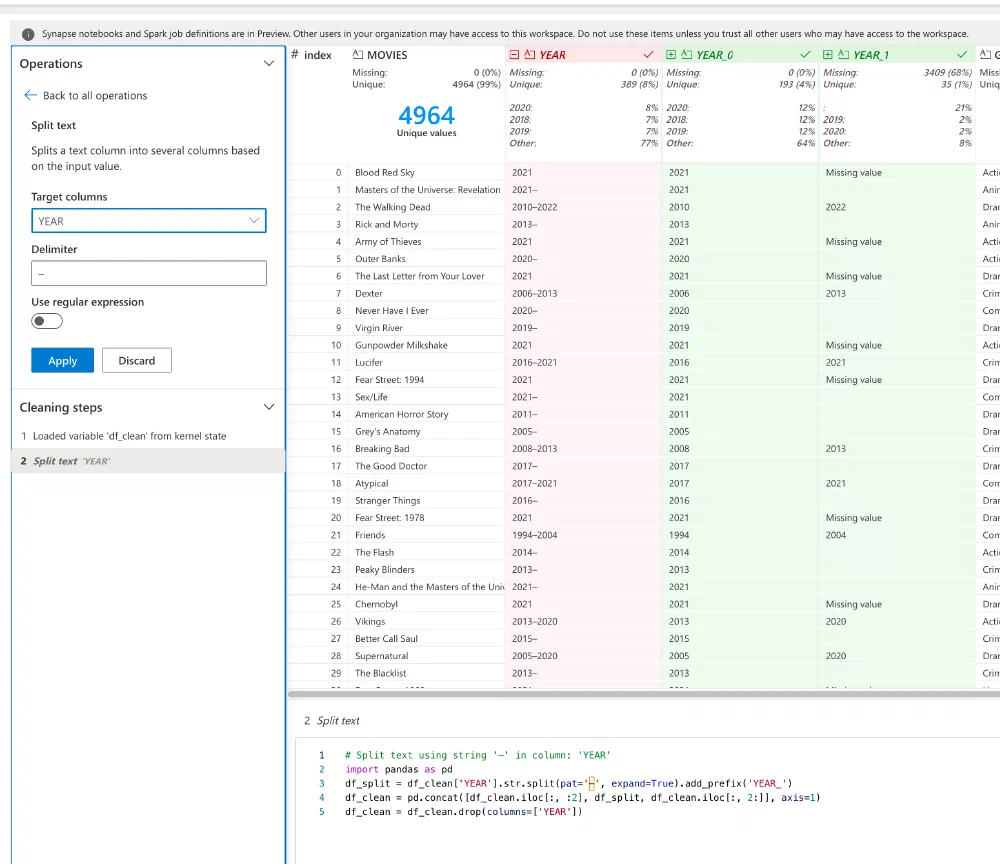
What’s really nice about this, is that you instantly get to see a preview of your operation so that you can fine-tune the parameters to get the result you want. I had no idea how many genres a movie or series could have, but what do you know, it’s 3!
I finished my wrangling by renaming some columns and sorting by the rating. This time I didn’t have to go through the operations menu, I could just right-click on the column and click Rename or Sort.
Now, let’s see how all of this translates to code! I clicked the Add code to notebook button again and it brought me back to my notebook.
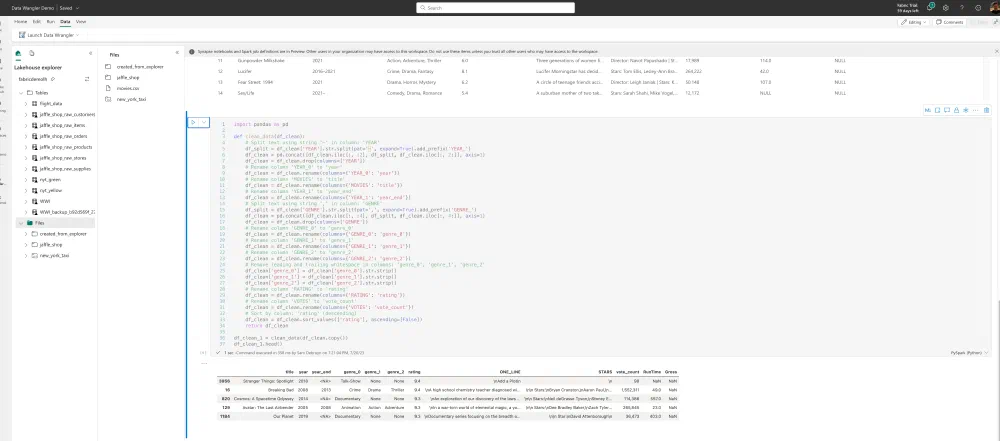
Once again it nicely documented my code as well:
 1# Split text using string '–' in column: 'YEAR'
 2df_split = df_clean['YEAR'].str.split(pat='–', expand=True).add_prefix('YEAR_')
 3df_clean = pd.concat([df_clean.iloc[:, :2], df_split, df_clean.iloc[:, 2:]], axis=1)
 4df_clean = df_clean.drop(columns=['YEAR'])
 5# Rename column 'YEAR_0' to 'year'
 6df_clean = df_clean.rename(columns={'YEAR_0': 'year'})
 7# Rename column 'MOVIES' to 'title'
 8df_clean = df_clean.rename(columns={'MOVIES': 'title'})
 9# Rename column 'YEAR_1' to 'year_end'
10df_clean = df_clean.rename(columns={'YEAR_1': 'year_end'})
11# Split text using string ',' in column: 'GENRE'
12df_split = df_clean['GENRE'].str.split(pat=',', expand=True).add_prefix('GENRE_')
13df_clean = pd.concat([df_clean.iloc[:, :4], df_split, df_clean.iloc[:, 4:]], axis=1)
14df_clean = df_clean.drop(columns=['GENRE'])
15# Rename column 'GENRE_0' to 'genre_0'
16df_clean = df_clean.rename(columns={'GENRE_0': 'genre_0'})
17# Rename column 'GENRE_1' to 'genre_1'
18df_clean = df_clean.rename(columns={'GENRE_1': 'genre_1'})
19# Rename column 'GENRE_2' to 'genre_2'
20df_clean = df_clean.rename(columns={'GENRE_2': 'genre_2'})
21# Remove leading and trailing whitespace in columns: 'genre_0', 'genre_1', 'genre_2'
22df_clean['genre_0'] = df_clean['genre_0'].str.strip()
23df_clean['genre_1'] = df_clean['genre_1'].str.strip()
24df_clean['genre_2'] = df_clean['genre_2'].str.strip()
25# Rename column 'RATING' to 'rating'
26df_clean = df_clean.rename(columns={'RATING': 'rating'})
27# Rename column 'VOTES' to 'vote_count'
28df_clean = df_clean.rename(columns={'VOTES': 'vote_count'})
29# Sort by column: 'rating' (descending)
30df_clean = df_clean.sort_values(['rating'], ascending=[False])
I’m really impressed with the Data Wrangler in Fabric. It’s a great way to learn Pandas code and it’s a great way to quickly understand and clean your data. I’m definitely going to use this more often!