Welcome to the third part of a 5-part series on an end-to-end use case for Microsoft Fabric. This post will focus on the data engineering part of the use case.
In this series, we will explore how to use Microsoft Fabric to ingest, transform, and analyze data using a real-world use case. The series focuses on data engineering and analytics engineering. We will be using OneLake, Notebooks, Lakehouse, SQL Endpoints, Data Pipelines, dbt, and Power BI.
All posts in this series
This post is part of a 5-part series on an end-to-end use case for Microsoft Fabric:
Use case introduction: the European energy market
If you’re following this series, feel free to skip this section as it’s the same introduction every time. 🙃
Since Russia invaded Ukraine, energy prices across Europe have increased significantly. This has led to a surge of alternative and green energy sources, such as solar and wind. However, these sources are not always available, and the energy grid needs to be able to handle the load.
Therefore, most European energy markets are converging towards a model with dynamic energy prices. In a lot of European countries, you can already opt for a dynamic tariff where the price of electricity changes every hour. This brings challenges, but also lots of opportunities. By analyzing the prices, you can optimize your energy consumption and save money. The flexibility and options improve a lot with the installation of a home battery. With some contracts, you could even earn money by selling your energy back to the grid at peak times or when the price is negative.
In this use case, we will be ingesting Epex Spot (European Energy Exchange) day-ahead energy pricing data. Energy companies buy and sell energy on this exchange. The price of energy is announced one day in advance. The price can even become negative when there will be too much energy on the grid (e.g. it’s sunnier and windier than expected and some energy plants cannot easily scale down capacity).
Since it’s quite a lot of content with more than 1 hour of total reading time, I’ve split it up into 5 easily digestible parts.
We want to ingest this data and store it in OneLake. At one point, we could combine this data with weather forecasts to train a machine learning model to predict the energy price.
After ingestion, we will transform the data and model it for dashboarding. In the dashboard, we will have simple advice on how to optimize your energy consumption and save money by smartly using a home battery.
All data is publicly available, so you can follow along in your own Fabric Workspace.
The goal
In our previous post, we created a Notebook to load the Epex Spot data for the current day for a single market. In this post, we’re going to automate this and load the data for all markets. We will be using a Data Pipeline in Fabric to do this.
Data Pipelines are a feature coming from Azure Data Factory and Azure Synapse Pipelines. They are a way to orchestrate data movement and transformation activities. They are built using a visual designer, but can also be exported as JSON and edited in a text editor. Later on, it will be possible to store these JSON versions in git and implement version control.
Pipeline
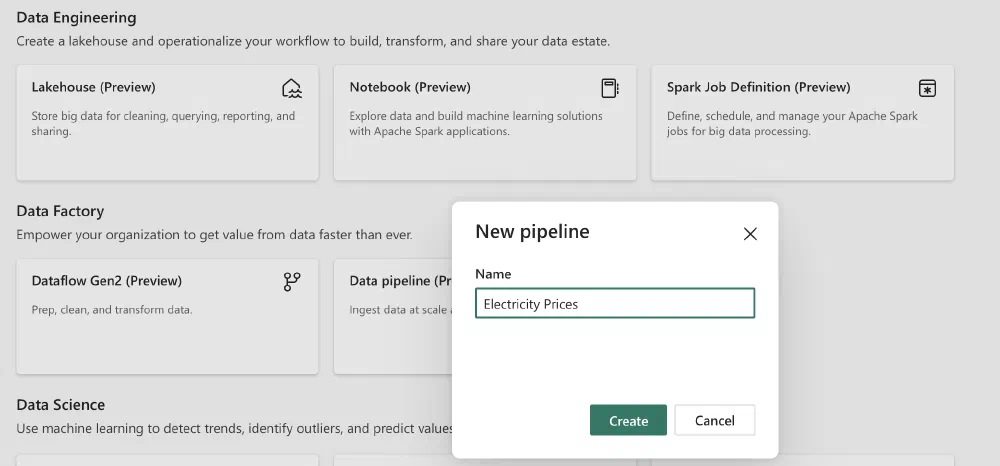
To create a Pipeline, go to the Data Engineering experience in Fabric and create a new Pipeline.
A Pipeline consists of a series of Activities and forms what is commonly called a DAG in the data engineering world. A DAG, Directed Acyclic Graph, are tasks that are connected to each other and can be executed in parallel or sequentially. They cannot have cycles, so you cannot link an Activity to an Activity that has already been executed. One Activity’s result can be linked to zero, one or more other Activities. You can also make an Activity be executed only when a previous Activity has failed or only when it has succeeded. Some Activities can be nested inside other Activities if the outer Activity is a control flow Activity like a loop or an if condition.
ForEach Activity & expressions
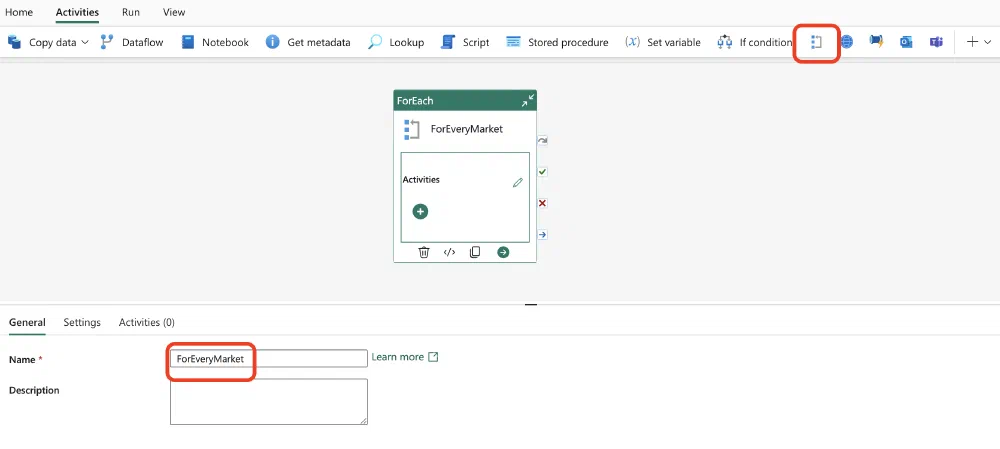
Since we want to do something and repeat the process for every market, we’re starting with a ForEach Activity. Click on the Activities tab and then on the icon for the ForEach Activity as indicated below. It will appear on the canvas and you can then click on it and give it a name.
Now we have to tell Fabric on what we want to loop. Click on the ForEach Activity and then on the Settings tab. Here you can specify the collection you want to loop over. In our case, we want to loop over the markets. We can do this by using a dynamic expression. Expressions help you make your Activities parametrized and dynamic. Since this is a feature coming from Azure Data Factory, you can consult the Azure Data Factory documentation on expressions for more information on the syntax. In our case, we want to loop over the markets, so we can use the following expression to build an array of the markets as strings:
1@createArray('AT','BE','CH','DE-LU','DK1','DK2','FI','FR','GB','NL','NO1','NO2','NO3','NO4','NO5','PL','SE1','SE2','SE3','SE4')
To enter the expression, we have to open the Pipeline expression builder by clicking on the Add dynamic content link that appears after highlighting the empty text box after Items. The expression builder will open and you can enter the expression.
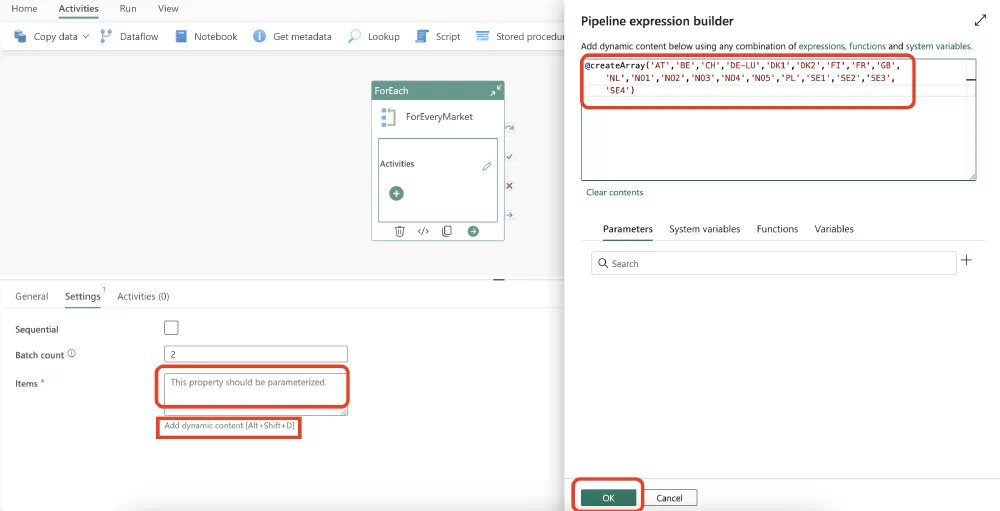
Click Ok after entering the expression to save it. I would also recommend setting the Batch count to 2 or 1 to avoid overloading your capacity as this task is not time critical anyway.
Notebook Activity
Now that we have a loop that goes over the markets, we have to tell the Pipeline what it should do on every iteration of the loop. Inside the ForEach Activity block, you can spot a pencil 📝 icon. This icon changes the canvas to the Activities that are inside the ForEach Activity. Once that is open, you can always click on the Main canvas link at the top left corner to return to the outer activities.
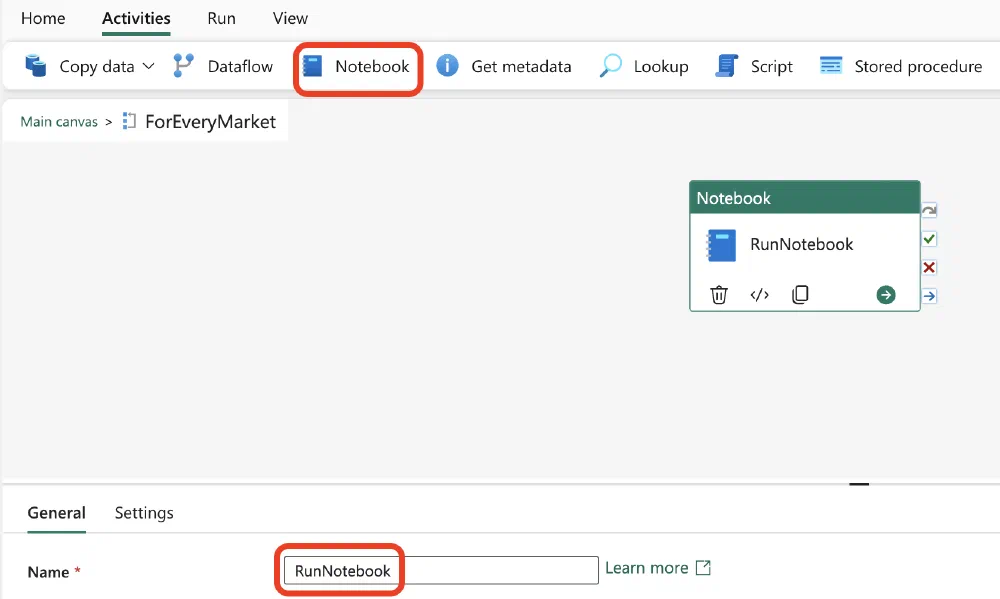
Inside this canvas, we can add an Activity to run a Notebook by clicking on the Notebook Activity at the top. At the time of writing, this is the third icon. Then click on the Activity to change its name.
Next, we have to configure the Notebook Activity to run our Notebook with the market as its parameter. This is where it all comes together.
Click on the Settings tab when you have the Activity open and select the Notebook from the dropdown.
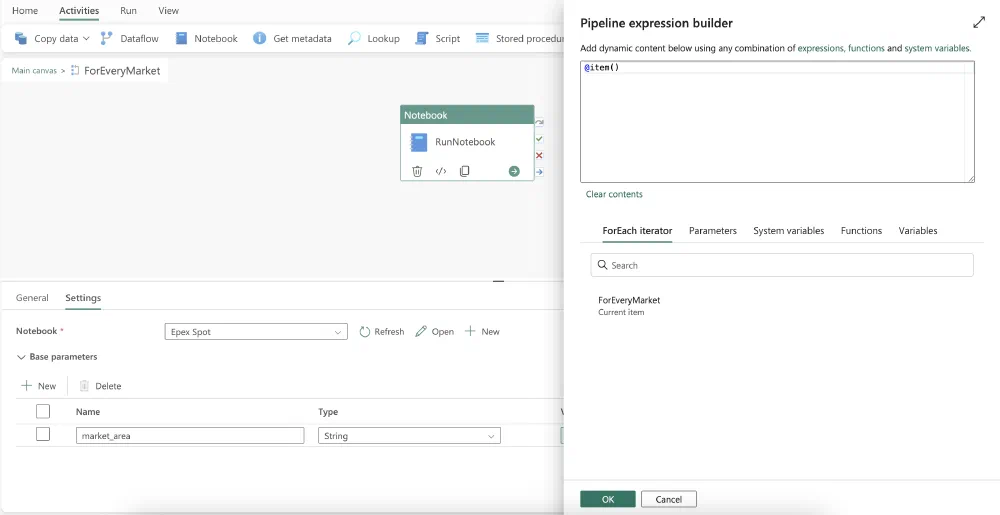
Then expand the Base parameters section and use the + New button to add a new parameter to the list. The name of the parameter should match the name of the variable in the Notebook. In our case, this is market_area. Make sure the Type is set to String. Now we have to link its value to the loop variable from the ForEach Activity since we are looping over every market one by one. To do this, click on the Value text box and then on the Add dynamic content link that appears. This will open the expression builder again. This time, we can use the following expression:
1@item()
Finish the configuration by clicking Ok and return to the main canvas by clicking on the Main canvas link at the top left corner.
Validation & first run
On the Home tab of the top menu, you can find a 💾 icon to save your work. There is also a :check_mark: Validate button to verify if you didn’t make any mistakes. If you did, you will get a message with the error. Otherwise, it will say No errors were found.
We’ve reached the point where it’s time to take our Pipeline for a spin. Click on the Run :play_button: icon to trigger the first run. A new tab named Output appears at the bottom of the screen.
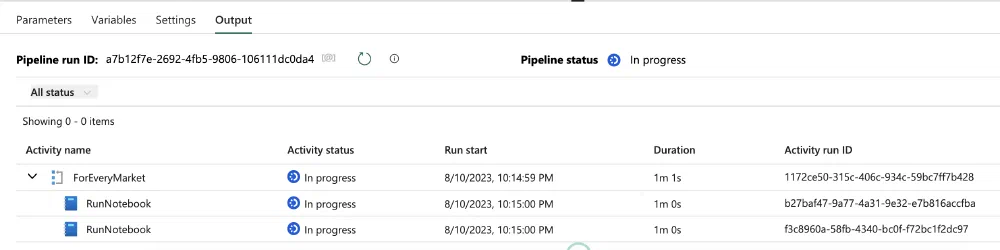
You can now follow step by step what the Pipeline is doing. Every Activity also has a few buttons to dive deeper into the monitoring & logging. The icon with the arrow pointing to the square shows the input of the Activity while the one with the icon pointing outwards the square shows the output of the Activity.
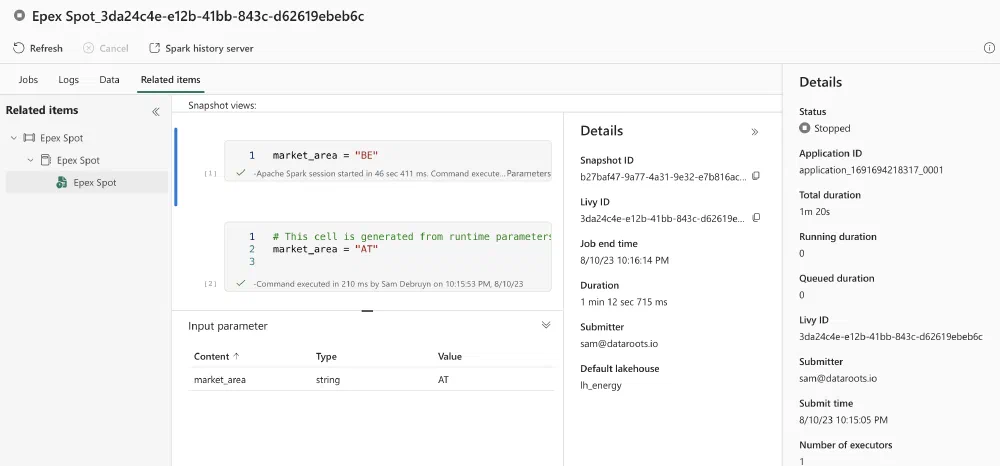
Specifically for Notebook and a few other Activities, you also see a :glasses: icon to open more details about the execution of the Notebook. In the new window that opens, you can find lots of detailed information: all the different Spark jobs that were executed as part of this Notebook with another link to open the Spark UI to dive into the details of the Spark job. You can also find the logs of the Spark cluster that executed the Notebook and on the Related items page, you can see the Notebook itself with the cell that has been added to set the market_area.
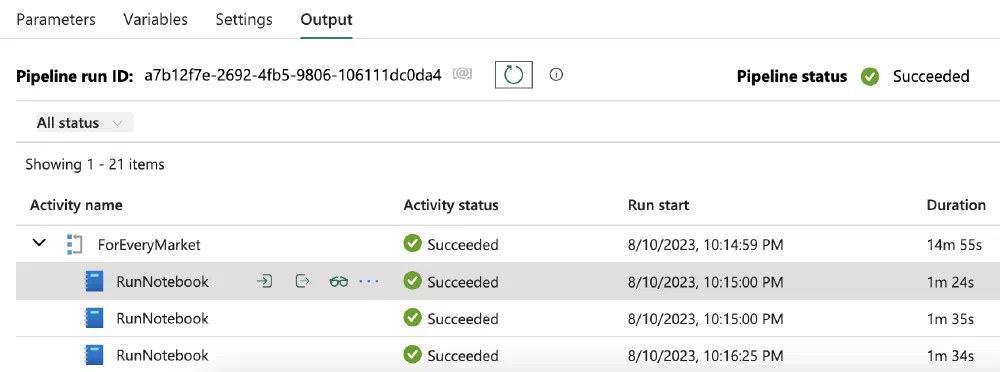
You can close the monitoring window and you should see that a line has appeared for every market and that the status of every line is Succeeded. The status for the ForEach Activity and the Pipeline itself should also be Succeeded once all Notebooks have finished executing. If not, you can open the 💬 and the monitoring pages to see what went wrong.
Scheduling
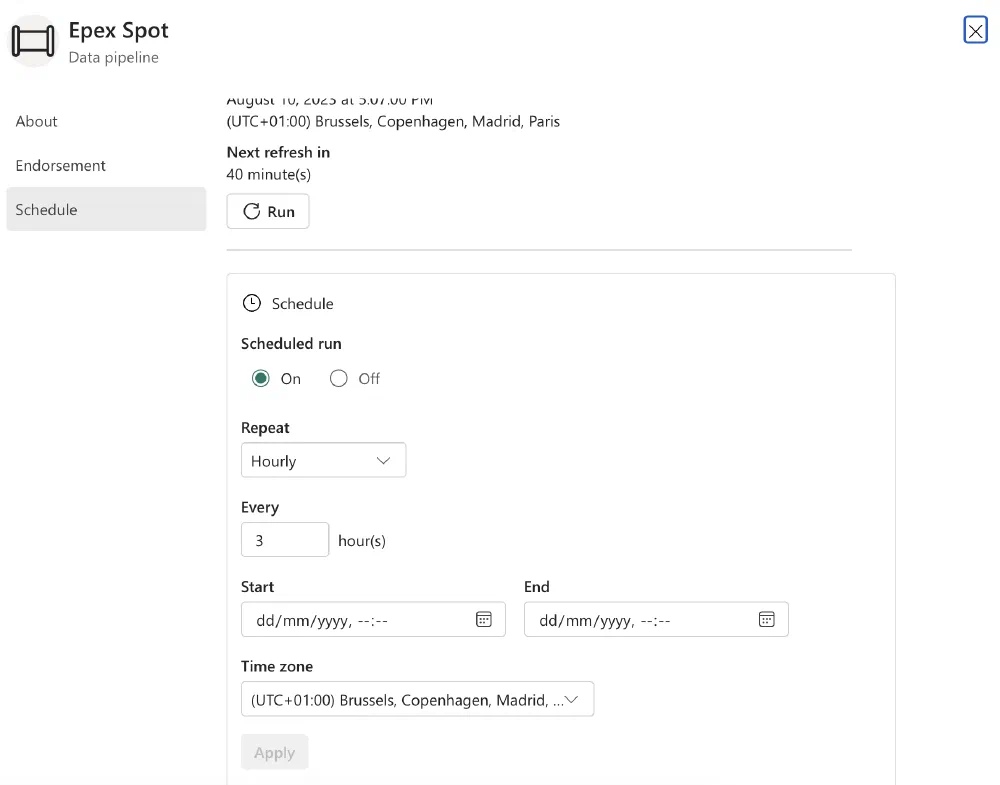
Now that we know that our Pipeline is working and executing our Notebook for every Market, all that’s left to ingest the data on a daily basis is scheduling the Pipeline. To do this, click on the 🗓️ Schedule icon.
A pop-up opens and we can easily schedule the Pipeline by the frequency we’d like. I’ve set mine to run every 3 hours as it is not known when pricing data becomes available and our Notebook will skip unnecessary work if there is no data or the data has already been ingested.
👉 Next part
In the next part, we will use the ingested data to generate some insights using dbt.
The link will start working as soon as the post is published, about a week after this one.