Welcome to the first part of a 5-part series on an end-to-end use case for Microsoft Fabric. This post will focus on the architecture overview of the use case.
In this series, we will explore how to use Microsoft Fabric to ingest, transform, and analyze data using a real-world use case. The series focuses on data engineering and analytics engineering. We will be using OneLake, Notebooks, Lakehouse, SQL Endpoints, Data Pipelines, dbt, and Power BI.
All posts in this series
This post is part of a 5-part series on an end-to-end use case for Microsoft Fabric:
Use case introduction: the European energy market
If you’re following this series, feel free to skip this section as it’s the same introduction every time. 🙃
Since Russia invaded Ukraine, energy prices across Europe have increased significantly. This has led to a surge of alternative and green energy sources, such as solar and wind. However, these sources are not always available, and the energy grid needs to be able to handle the load.
Therefore, most European energy markets are converging towards a model with dynamic energy prices. In a lot of European countries, you can already opt for a dynamic tariff where the price of electricity changes every hour. This brings challenges, but also lots of opportunities. By analyzing the prices, you can optimize your energy consumption and save money. The flexibility and options improve a lot with the installation of a home battery. With some contracts, you could even earn money by selling your energy back to the grid at peak times or when the price is negative.
In this use case, we will be ingesting Epex Spot (European Energy Exchange) day-ahead energy pricing data. Energy companies buy and sell energy on this exchange. The price of energy is announced one day in advance. The price can even become negative when there will be too much energy on the grid (e.g. it’s sunnier and windier than expected and some energy plants cannot easily scale down capacity).
Since it’s quite a lot of content with more than 1 hour of total reading time, I’ve split it up into 5 easily digestible parts.
We want to ingest this data and store it in OneLake. At one point, we could combine this data with weather forecasts to train a machine learning model to predict the energy price.
After ingestion, we will transform the data and model it for dashboarding. In the dashboard, we will have simple advice on how to optimize your energy consumption and save money by smartly using a home battery.
All data is publicly available, so you can follow along in your own Fabric Workspace.
Architecture overview
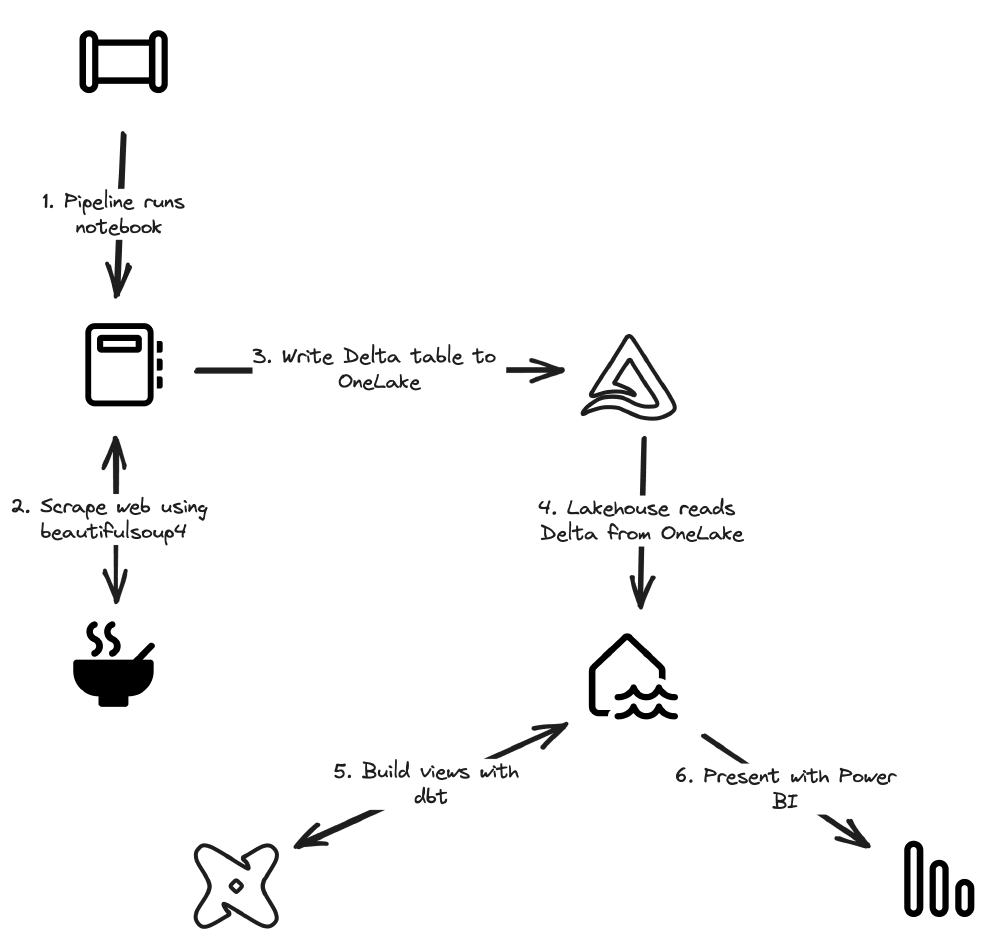
In the diagram above you can see the 6 components of the data flow. Most of them are Fabric components, with 2 exceptions: Beautiful Soup and dbt. We’ll go over the components one by one, talk a bit about the people typically involved in such a project, and conclude with an overview of the data flows.
If you’re wondering where I got these icons from, check out my previous post listing all Fabric icons for creating your own architecture diagrams.
Web scraping with Beautiful Soup 4
BeautifulSoup 4 is a Python library that is used to scrape data from the web. Unfortunately, the electricity prices are not available in a machine-readable format, so we need to scrape them from this page where they’re published as soon as they are available. Beautiful Soup can load the web page and extract the data we need from it. This process is called scraping.
After retrieving the data, we store it in a Delta table on OneLake. That way, we can use a Lakehouse and the included SQL Endpoint to work with the data in SQL.
Building views with dbt
dbt is a tool for analytics engineers where you can use SQL with Jinja templating to make that SQL easier to use and add functionalities. By using dbt, we can leverage a lot of best practices from software engineering in our analytics projects. All will become more clear in the post dedicated to this part of the use case. 😉
Fabric components
As the goal of the use case is to demonstrate the capabilities of Fabric, we’ll be using a lot of Fabric components. You could build this in many different ways using Data Flows, Data Warehouses, etc. but those didn’t make into this use case. The main components of this use case are the Lakehouse and its features.
OneLake
OneLake is the centralized data lake in Fabric. You can read more about OneLake in my previous posts . By using OneLake we don’t have to worry about things like credentials, security, networking, and more. Fabric’s OneLake handles all of that for us.
Lakehouse
The Lakehouse is one of Fabric’s engines running on top of OneLake. It features an extensive Python runtime for running PySpark or other Python applications.
The main feature here is the Lakehouse’s ability to automatically discover datasets stored in the open-source Delta Lake format. Those datasets become automatically available for querying in the SQL Endpoint.
The personas: data engineering and analytics engineering
As you’ll see, this work can be done by a single person. But I chose to split it up into data engineering and analytics engineering as that is those are the typical workloads you see in a data team.
The data engineer is responsible for the data flow from the source to the data store. This also includes building and configuring the data platform to handle this data at scale. Usually, the data engineer will be using a programming language like Python to build the data pipelines. Alternatively, a lot can be done with low-code interfaces in Fabric like Data Flows and Data Pipelines. We’ll use both to demonstrate the possibilities.
The analytics engineer is responsible for transforming that data and building insights from it. The analytics engineer transforms the data and then goes on to visualize data marts to make the information available to the end user. Typically, analytics engineers work with SQL and SQL-based tools like dbt to transform the data. Power BI is one of the best options available to visualize the data, but there are many others as well.
Data flow
The data flow is pretty simple. The data is scraped from the web and stored in a Delta table on OneLake. Then, dbt is used to build views on top of that data. Those views are then visualized using Power BI.


👉 Next part
In the next part, we’ll build up the Notebook and look at the logic that goes into building a redundant, reliable, but simple data pipeline.
The link will start working as soon as the post is published, about a week after this one.